Add a cursor to the data trace on a Strip or Block display to show the value of a specific data point.
You can add up to two cursors to the channel data on a Strip or Block display.
Cursors can only be added to one channel at a time on a display.
The color of the cursor corresponds to the color of the selected channel.
Cursors can be added to a display before or during the acquisition.
To add cursors to a display, complete the following steps:
If data is being acquired, click on the lock icon to enter review mode, otherwise proceed to step 2.
Click on a cursor icon (Cursor A or Cursor B ).
A circle with a cross hair is added the data plot of the currently selected channel. The x-coordinate shows either the acquisition time (absolute or relative) or the sample number, depending on the X-axis Display Mode setting. The y-coordinate shows the sample value.
Click on the other cursor icon to add a second cursor to the display.
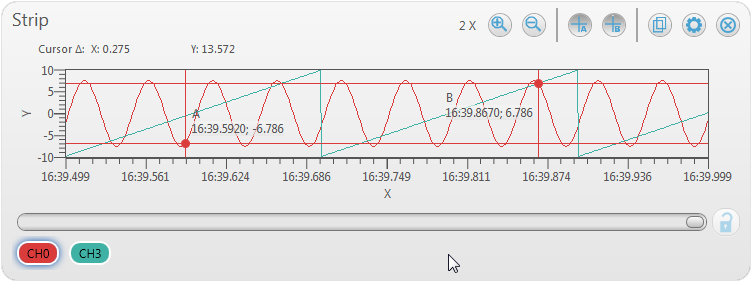
When two cursors are added, the display shows the time and amplitude deltas between the two cursors.
Click and drag one of the circles along the data plot to show the value of each data point on the plot. An A or B identifies the cursor on the display.
Click the unlock icon to exit review mode and resume the acquisition, if one was running.
The image below shows two cursors added to channel 0 on the Strip display.
Click the cursor icon again to remove the cursor from the display.
To show the value of the data points on a different channel, click the channel icon. The cursors move to the selected channel.
Zooming in and cursors
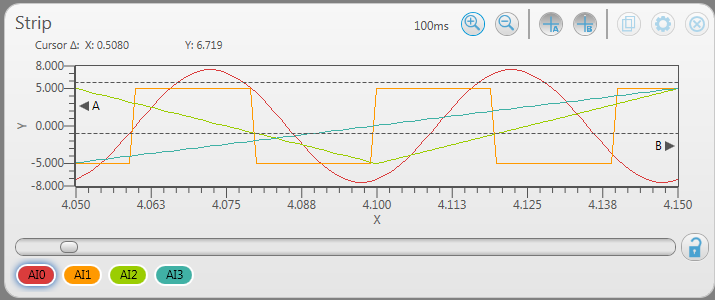
If you add cursors to a Strip or Block display and then zoom in on the data so that the cursors move outside the range of the displayed data, arrows (, )are added for each cursor to indicate their position relative to the current data view.
Video Demo
Click the Play button below to see a video showing how to show the value of a data point with a cursor.
If you are unable to view this video, play the DAQami Video Demo for detailed information about how to set up a configuration and acquire data with DAQami.