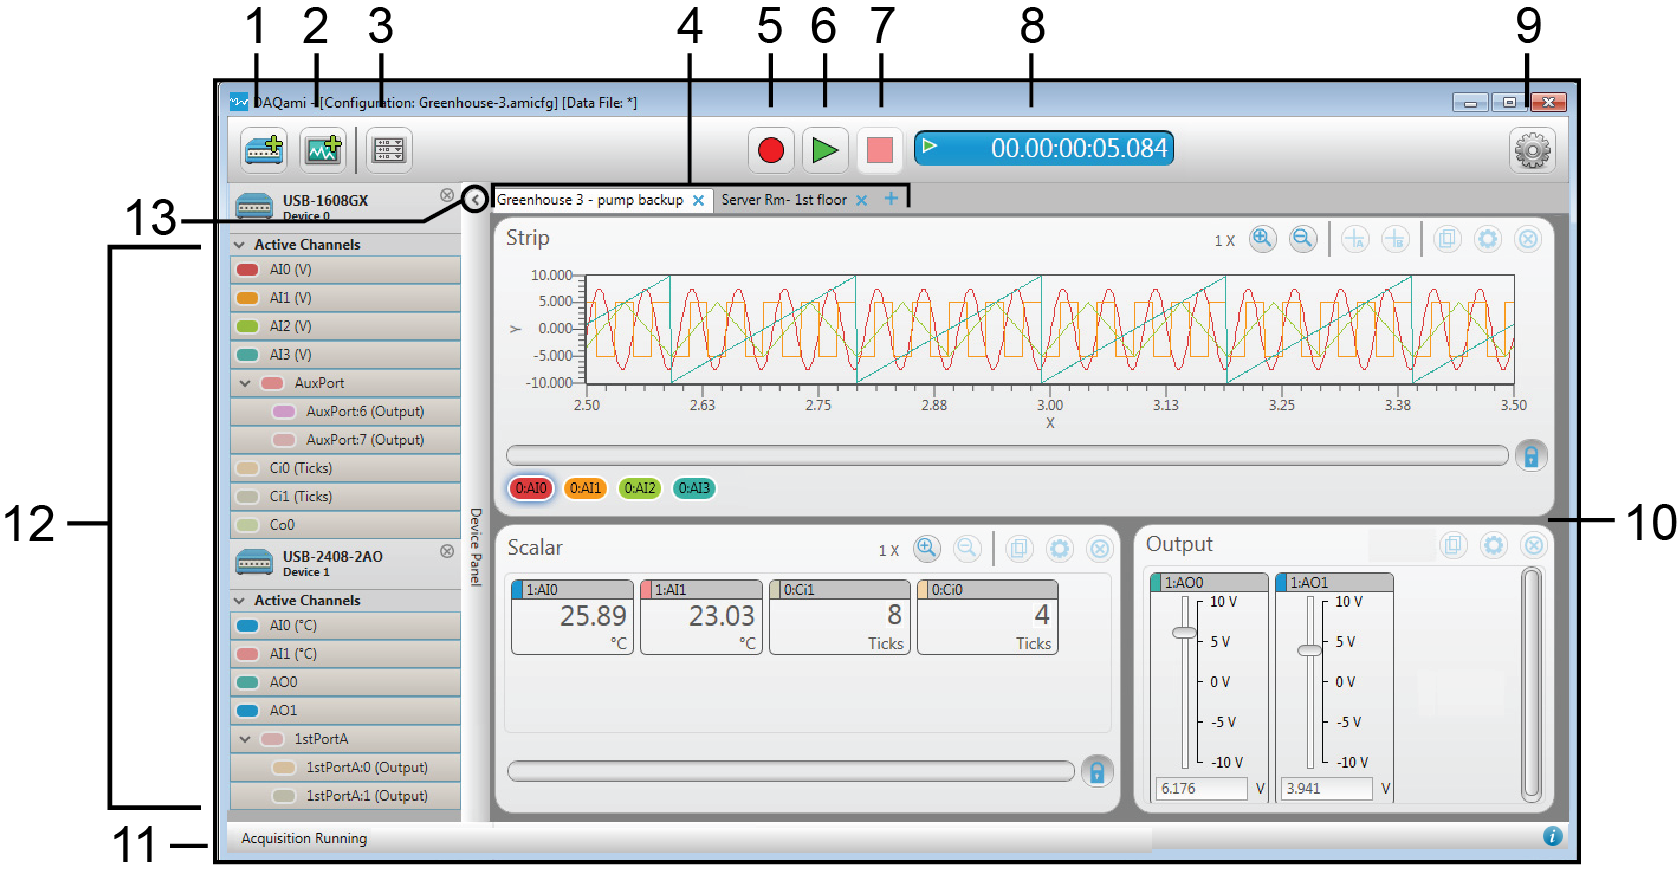
The image below identifies each component in the main window of the DAQami interface.
Refer to the callout numbers for a description of each component.
| Callout | Name | Description |
| 1 | Add Device button | Lists the devices that you can add to the acquisition. Drag a device onto the Device Panel to add it to the acquisition. Disabled while acquiring data. |
| 2 | Add Display button | Lists the displays that you can add to the acquisition, and opens the Display Panel. Drag a display onto the Display Panel to add it to the acquisition. Disabled while acquiring data. |
| 3 | Panel button (toggle) | Toggles between the Configuration Panel button and the Display Panel button.
|
| 4 | Display tabs | Use tabs to organize displays. Click |
| 5 | Log button | Click |
| 6 | View button | Click |
| 7 | Stop button | Click |
| 8 | Logging duration | Displays the running time of an active acquisition using the format days.hours:minutes:seconds:milliseconds. |
| 9 | Gear icon | Opens a menu with options for working with configuration and data files, configuring log file settings, setting default preferences, opening this Help file, and exiting the application. |
| 10 | Display/Configuration Panel (toggle) | The Display Panel shows the displays added to the acquisition, and data acquired during the current session. The Configuration Panel shows settings to configure the device, channels, sample rate, and triggers. Click the Panel button |
| 11 | Acquisition status | Displays one of the following status descriptions in the left edge of the window:
 If an open thermocouple is detected, a warning icon |
| 12 | Device Panel | Shows the devices added to the acquisition, and the Active Channels list for each device. Drag an active channel onto a display to show the data acquired from the channel. If an open thermocouple is detected, a warning icon |
| 13 | Show/Hide (Device Panel) | Click to hide the Device Panel. Click again to show the Device Panel. |