Click the Axes tab on the Display Settings dialog box to customize the x-axis and y-axis on a Strip or Block display. To open this dialog box, click the Display Settings icon ![]() on the display.
on the display.
Note: The Axes tab is not available when you open the Display Settings dialog box for a Scalar display.
Complete the following steps to customize the x-axis and y-axis:
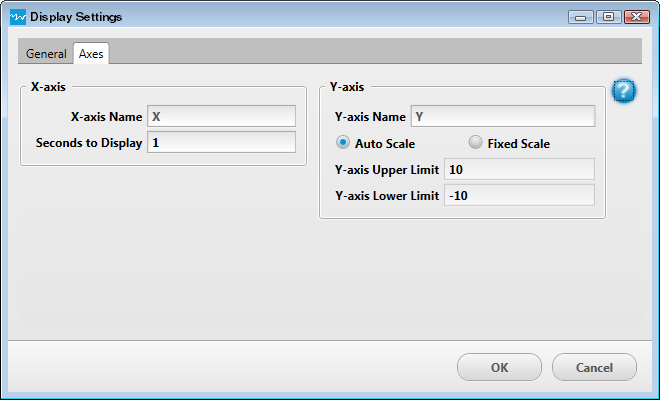
| Display Settings Dialog Box – Axes Tab | |
| X-axis | |
| X-axis Name | The x-axis name; this value displays below the x-axis. |
| Y-axis | |
| Y-axis Name | The y-axis name; this value display to the left of the y-axis. |
| Scale option buttons | The y-axis scale mode. Select the mode from the following option buttons:
|
| Y-axis Upper Limit | The upper limit of the y-axis. The upper limit must be greater than the lower limit. This setting is disabled when the Auto Scale option button is selected. |
| Y-axis Lower Limit | The lower limit of the y-axis. The lower limit must be less than the upper limit. This setting is disabled when the Auto Scale option button is selected. |
Click OK to apply the settings to the display and to close the dialog box. Axes settings are saved to the data file during an acquisition, and also to a saved configuration file.