Strip Display
A Strip display shows data continuously scrolling from right to left. The components of a Strip display are shown here:
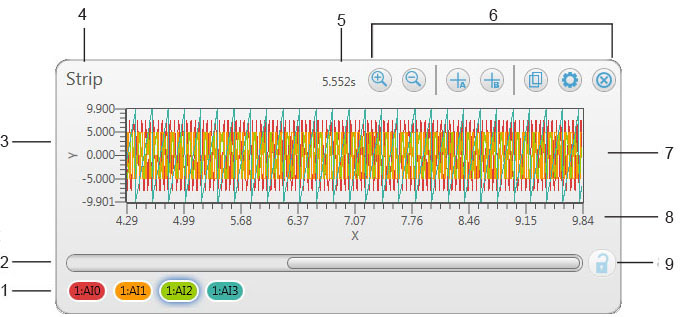
Refer to the callout numbers below for a description of each component on a Strip display.
| Callout | Name | Description |
| 1 | Channel icons | The channel(s) whose acquired data is plotted on the display. The color of the channel icon corresponds to the color of the data trace. Right-click on the channel icon to show a context menu with options to remove the channel or change its color. |
| 2 | Scrollbar | A horizontal scrollbar that you can slide left or right to review sample data. The scrollbar is only available in review mode during an acquisition, and when DAQami is idle. |
| 3 | Y-axis | The upper and lower range limits of the y-axis. You set the range limits and scale mode with the settings on the Axes tab of the Display Settings dialog box. |
| 4 | Display title | The title of the display (refer to Display Title in Configuring Display Settings). |
| 5 | Time span of displayed data | Displays the span of time represented by each screen of data on the display. The amount of time represented by each screen increases as you zoom out, and decreases as you zoom in. |
| 6 | Icons | Icons used to zoom in or out, add cursors, customize the display, and remove the display from the Display Panel.
 | Zooms in on display data. |
 | Zooms out of display data. |
 | Adds a cursor to display the value of a data point. |
 | Adds another cursor to display the value of a second data point. |
 | Copies the display to the clipboard. |
 | Opens the Display Settings dialog box where you customize the display appearance. |
 | Removes the display from the Display Panel. |
|
| 7 | Acquired data | The acquired data displays continuously from left to right. You set the time range of samples to show on a display with the Seconds to Display textbox on the Axes tab of the Display Settings dialog box. |
| 8 | X-axis | The absolute time, relative time, or sample count of the acquisition.
- Absolute Time – the time of day when samples are acquired.
- Relative Time – the length of time since the acquisition began.
- Sample count – the number of data samples acquired.
You set the display mode on the Preferences dialog box. |
| 9 | Toggle live /review mode | Click on the lock icon to toggle the display between live and review mode while an acquisition is running.
 | When the lock icon is locked, the display is in live mode and updates as data is acquired based on the configuration.
Click on the icon to change to review mode. |
 | When the lock icon is unlocked, the display is in review mode. A horizontal scrollbar appears on the display for reviewing samples. Data continues to be acquired based on the configuration.
Click on the icon to change to live mode. |
|
To show a grid on the display, select the Show Grid checkbox on the Display Settings dialog box.
Context menus
Right-click anywhere except for the scrollbar and channel icons on a Strip display to show the following menu:
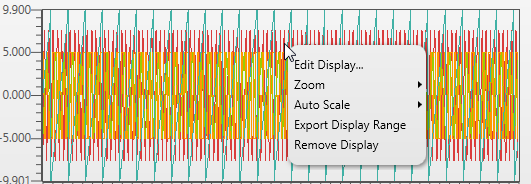
- Edit Display: opens the Display options dialog box. Only enabled when DAQami is idle.
- Zoom»Zoom In: zooms in on the data. Enabled when an acquisition is running and when DAQami is idle.
- Zoom»Zoom Out: zooms out on the data. Enabled when an acquisition is running and when DAQami is idle.
- Auto Scale»Auto Scale X: scales the X-axis to show all acquired data (up to 1 million samples). This setting can be changed when an acquisition is running and when DAQami is idle.
- Auto Scale»Auto Scale Y: scales the y-axis based on the current minimum and maximum readings in the display.
Only available if Lock Auto Scale Y option is deselected. This setting can be changed when an acquisition is running and when DAQami is idle.
- Auto Scale»Lock Auto Scale Y: when selected, the y-axis scale continuously updates as new minimum and maximum readings are acquired. This setting can be changed when an acquisition is running and when DAQami is idle.
- Export Display Range: exports the currently displayed data to a .csv file. Only enabled when DAQami is idle.
The Export Options dialog box includes the following settings:
- Export Path: Click Browse to navigate to the location where you want to export the .csv data file(s). Data is exported by default to the \Users\<current user>\Documents\Measurement Computing\DAQami folder.
- Data Precision (Decimal Places): Enter the number of decimal places to include in the exported data
- Use Relative Time: Select this checkbox to export the data with the relative time that the data was acquired. Leave this checkbox unchecked to export the absolute time that data was acquired.
- Limit Range: Select this checkbox to export a subset of the data based on a time range. You can specify the range using Absolute Time or Relative Time. Each range updates based on changes to the other.
- Preview: Click this button to show the exported data before creating the .csv file.
- Remove Display: removes the Strip display from the Display tab.
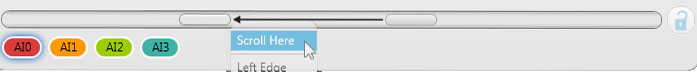
Right-click on the scrollbar to show the following menu:
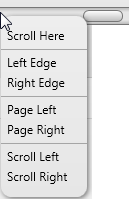
This menu is only available when an acquisition is running in review mode and when DAQami is idle.
- Scroll Here: scrolls data to the location of the mouse (scrollbar thumb moves to the left edge of the context menu).
- Left Edge: scrolls to the beginning of the acquired data (scrollbar thumb moves to the left edge of the scrollbar track).
- Right Edge: scrolls to the end of the acquired data (scrollbar thumb moves to the right edge of the scrollbar track).
- Page Left: depending on the current zoom settings/time span of displayed data, displays the previous screen of data. For example, if each screen represents one second of data, the thumb moves left to display the previous one second of data.
- Page Right: depending on the current zoom settings/time span of displayed data, displays the next screen of data. For example, if each screen represents one second of data, the thumb moves right to display the next one second of data.
- Scroll Left: depending on the current zoom settings/time span of displayed data, scrolls data 1/10 of a screen of data to the left. For example, if each screen represents one second of data, the thumb moves left the equivalent of 1/10 second of data, and the displayed data updates accordingly.
- Scroll Right: depending on the current zoom settings/time span of displayed data, displays the next screen of data. For example, if each screen represents one second of data, the thumb moves right the equivalent of 1/10 second of data, and the displayed data updates accordingly.
See Also
Block Display
Scalar Display
Adding a Cursor to a Display
Configuring Display Settings
Configuring Axes Settings
Display Tasks
DAQami Preferences